
Adding Observability to a Flask Application
With Grafana Cloud
For my day job, I have spent the last month spending a lot of time looking at observability vendors and comparing and contrasting their offerings. As part of this, I saw a demo of Grafana Cloud's platform, and was especially interested in their new Kubernetes and Application visualizations. As a hands on learner, I decided to take them for a spin with my side project to get an idea of what is involved.
Install Grana Agent
The first task is really "sign up for grafana cloud", but didn't think that needed to be said. When you do so, they give you an instance of Grafana you can log into. Inside you can go to Observability > Kubernetes > Configuration and get to a page that explains how to install the agent on your cluster.
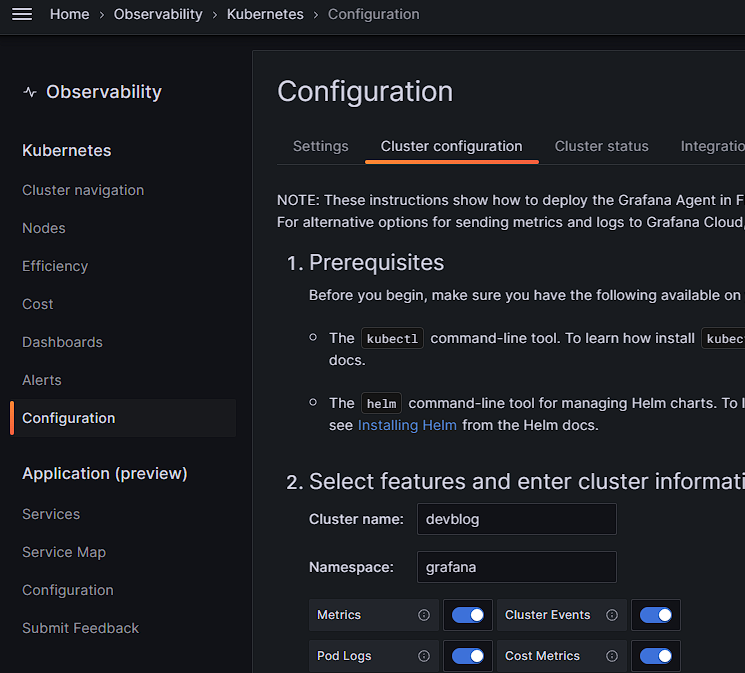
Turns out, this will give you a preconfigured `helm install` command with some values populated in a values.yaml file. The chart they are using is https://github.com/grafana/k8s-monitoring-helm/tree/main/charts/k8s-monitoring. This wound up being important to know later- it took a decent amount of splunking for someone like myself who had never before used the grafana agent to get things working correctly. I immediately noticed that they wanted me to pass the API token I had just created into the values file, but considering my intention was to use my existing terraform config and I wasn't interested in putting that token in my git repo, I had to fiddle immediately. The typical pattern for helm charts is to allow passing either the secret itself OR the name of an existing kubernetes secret- but their chart doesn't support the second option. I handled it by passing it as a terraform value directly to the chart.
resource "helm_release" "grafana_agent" {
    name       = "grafana-agent"
    repository = "https://grafana.github.io/helm-charts"
    chart      = "k8s-monitoring"
    version    = "0.1.15"
    namespace  = kubernetes_namespace.grafana.metadata.0.name
    set_sensitive {
        name  = "externalServices.prometheus.basicAuth.password"
        value = var.grafana_token
    }
    set_sensitive {
        name  = "externalServices.loki.basicAuth.password"
        value = var.grafana_token
    }
    values = [data.template_file.grafana_agent.rendered]
}
My first values.yaml file covered things like the prometheus endpoint, and looked like
cluster:
  name: "devblog"


externalServices:
  prometheus:
    host: "https://prometheus-prod-13-prod-us-east-0.grafana.net"
    basicAuth:
      username: "1171240"

  loki:
    host: "https://logs-prod-006.grafana.net"
    basicAuth:
      username: "684695"

opencost:
  opencost:
    exporter:
      defaultClusterId: "devblog"
    prometheus:
      external:
        url: "https://prometheus-prod-13-prod-us-east-0.grafana.net/api/prom"
This actually was enough to get quite a bit of progress! This got me metrics and logs collected across my cluster. (It actually took like four hours but not because of grafana- I realized while I was setting it up that my autoscaling configuration was-suboptimal-and spent a lot of time fiddling with that. End result of that will probably save me around $50 a month on this setup, which is very nice. If only EKS didn't charge so much for the control plane! I digress though...)
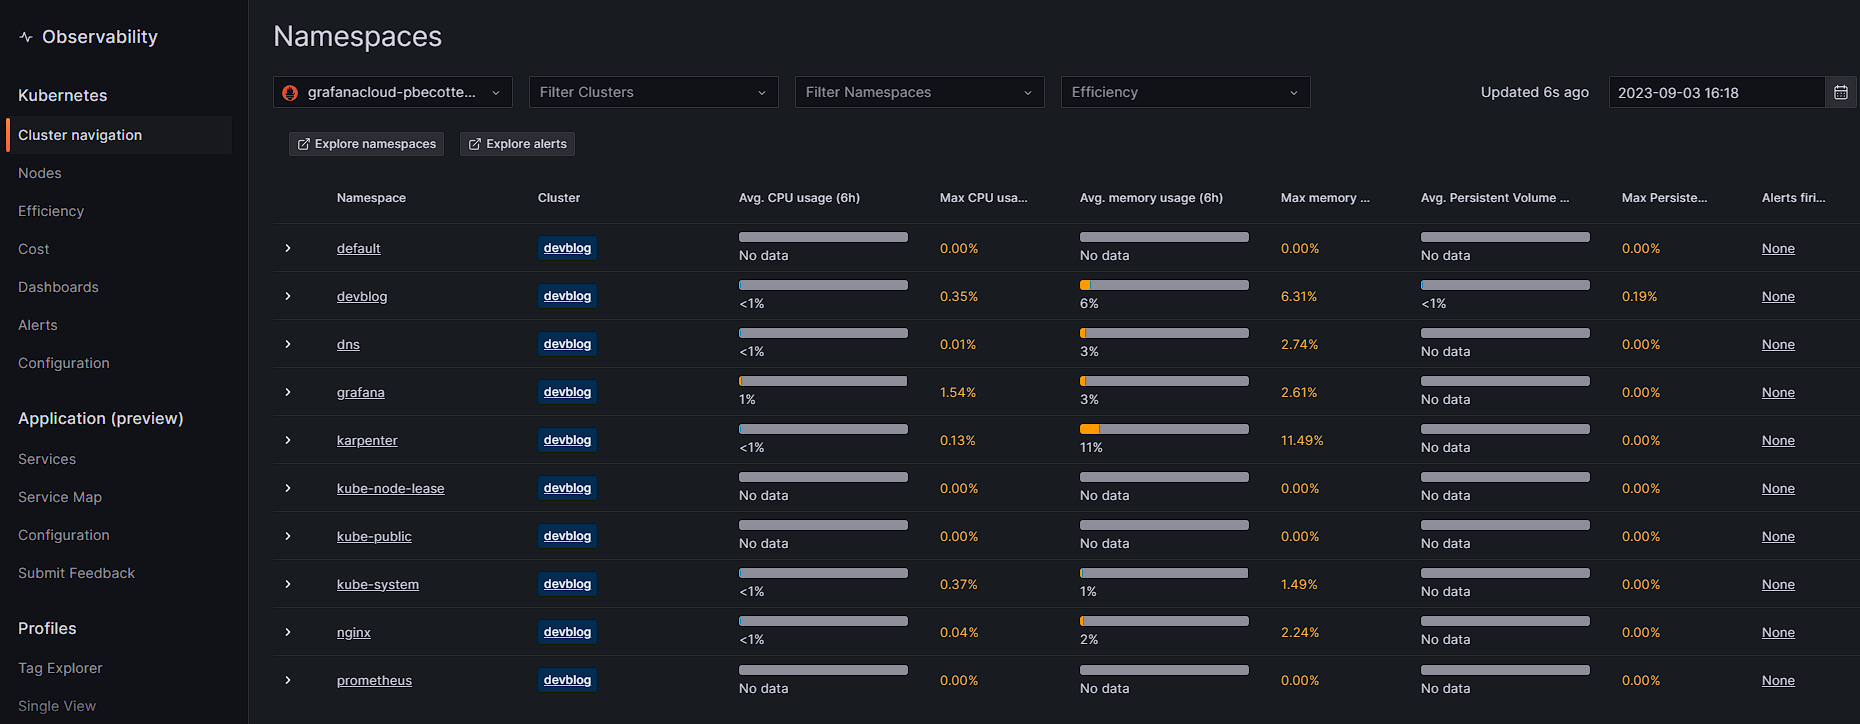
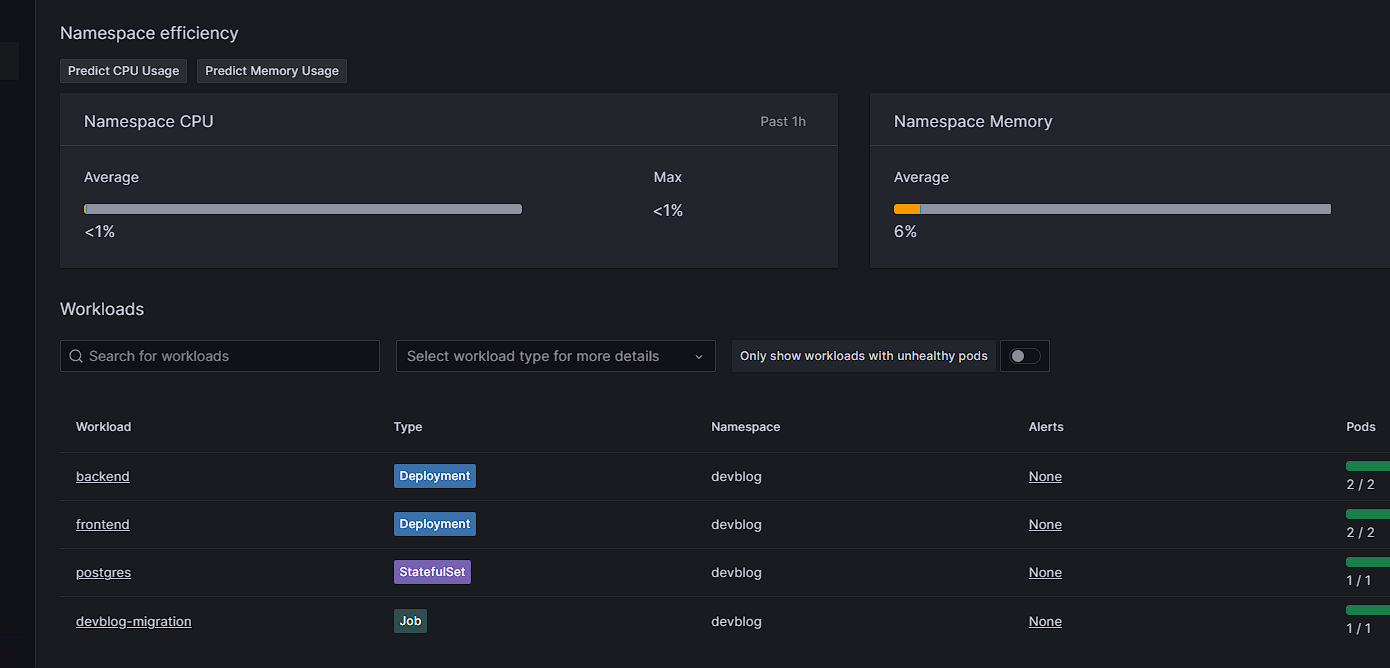
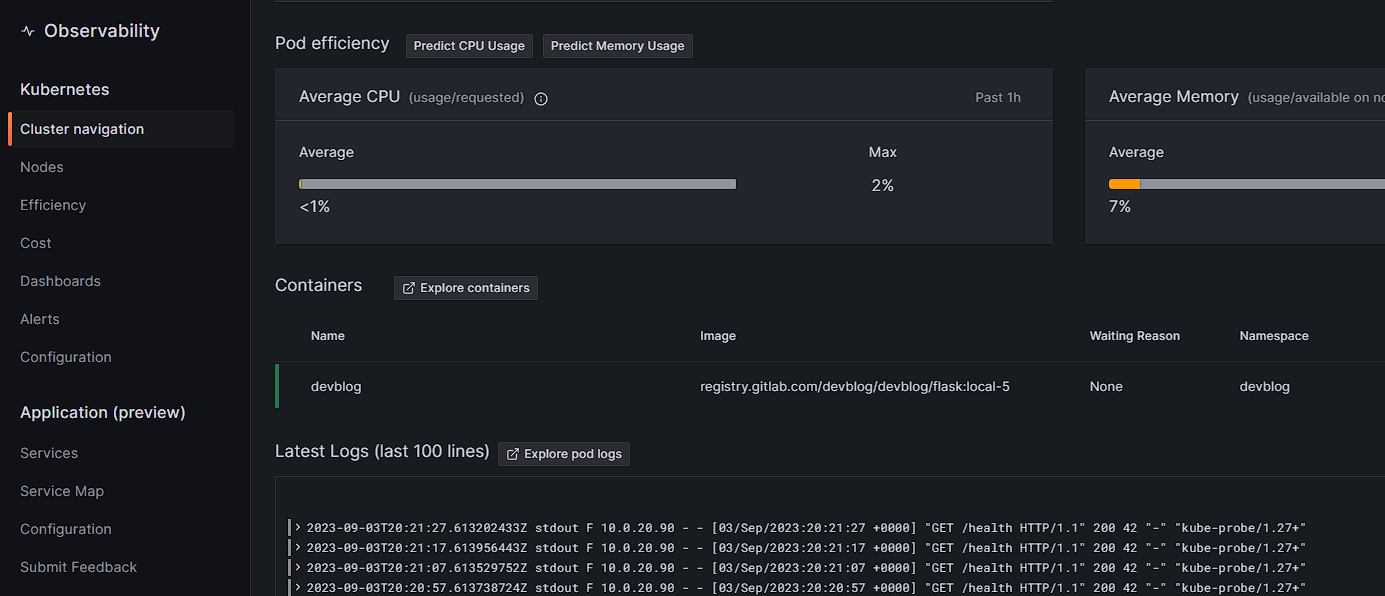
You can click through and inspect the various kubernetes objects, see overall usage stats for cpu/memory at the cluster level, and when looking at a specific pod can even see the logs for that pod. I was overall pretty happy with this setup. I didn't like that it was hard to click through to some things, such as seeing host metrics or traces from a pod or node. The interface for alerts in particular is bad, it took me a very long time to figure out how to see the actual pod that was failing when my cluster showed an alert for a pod in backoff.
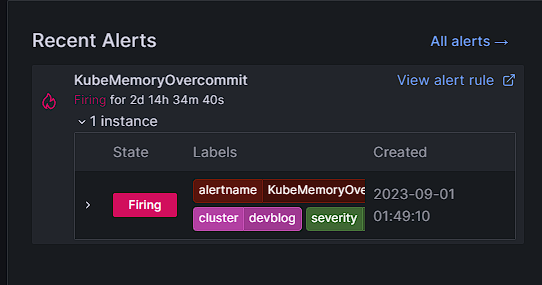
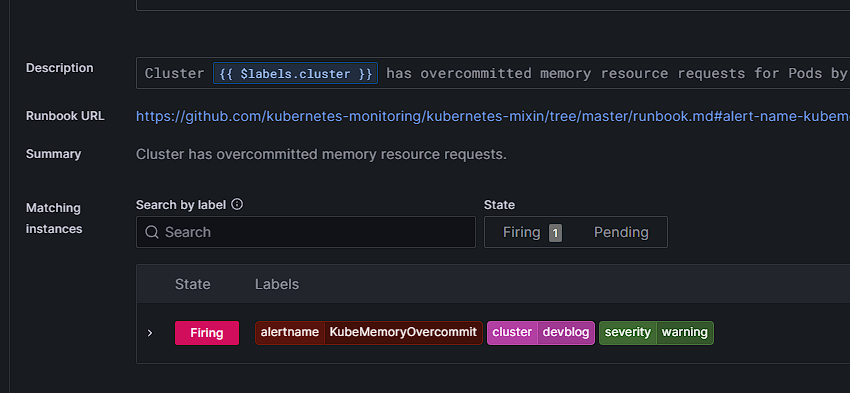
(after clicking to the second page, you can expand the arrow to see the string with the template filled in)
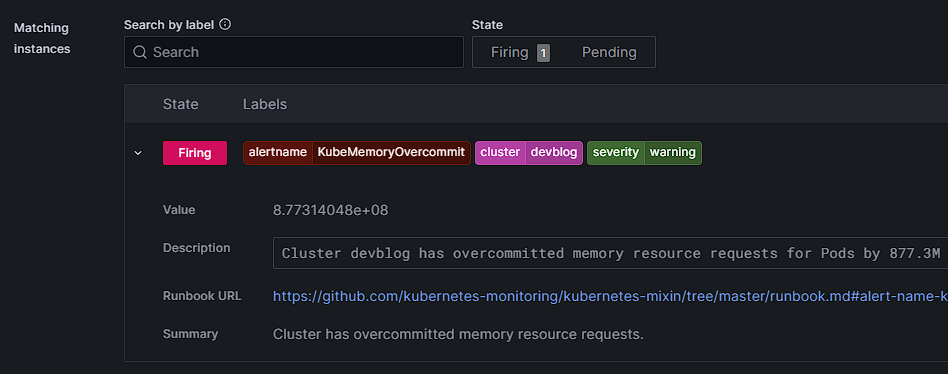
Integrations
In tried installing two integrations from the configuration section under kubernetes. They try to make it easy by showing code snippets intended to be added to the helm chart values.yaml. It took me a few iterations to understand, but makes sense.
nginx
I have nginx both with nginx-ingress and to serve my static react files.
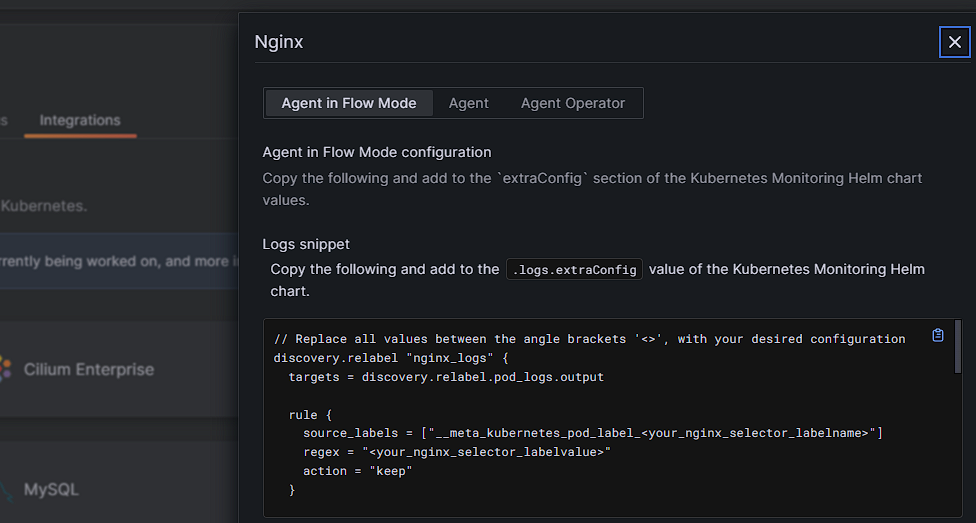
For nginx it processes the log messages. It took me a bit to understand the syntax around `source_labels` but I got there. Basically I had to add a label (I went with `log_type=nginx`) and a processor will parse the logs. I was able to get it setup so that the integration recognized the logs and got the following dashboard-
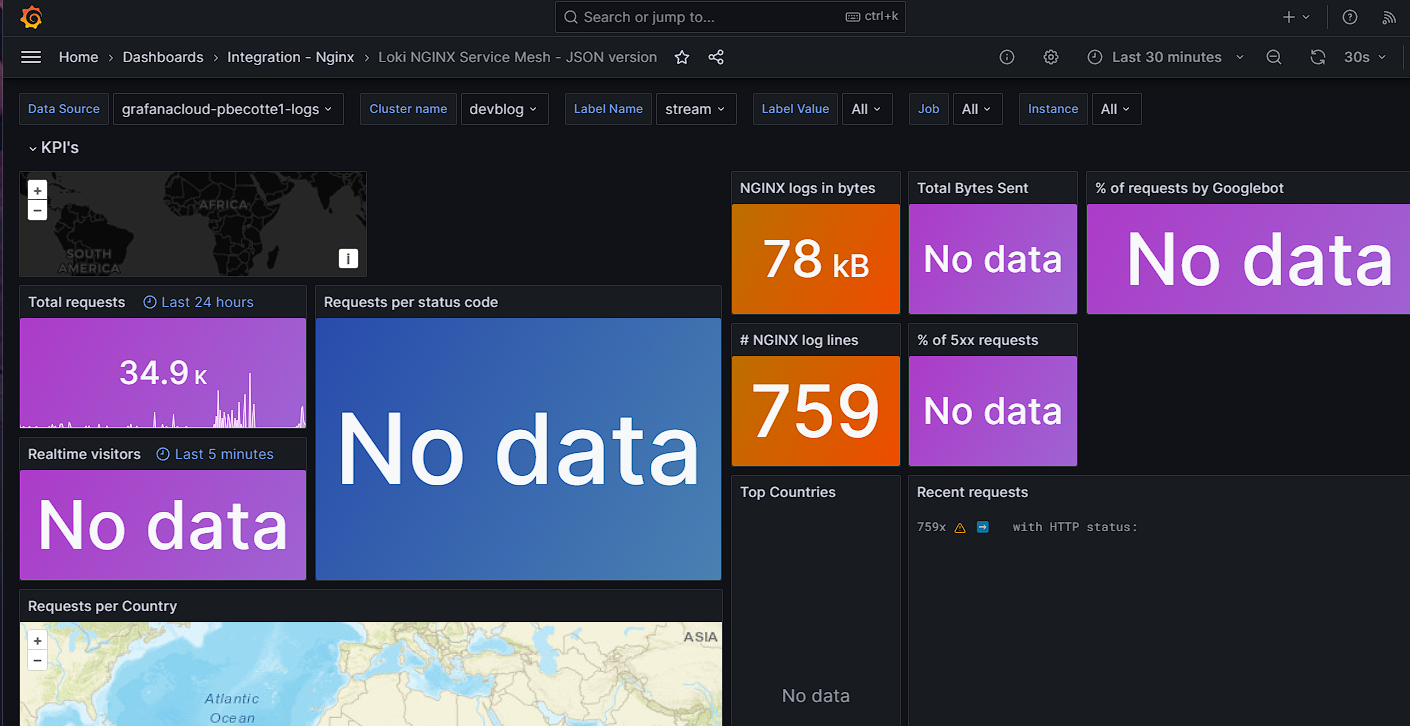
Which- isn't super helpful. The logs for the pod look right-
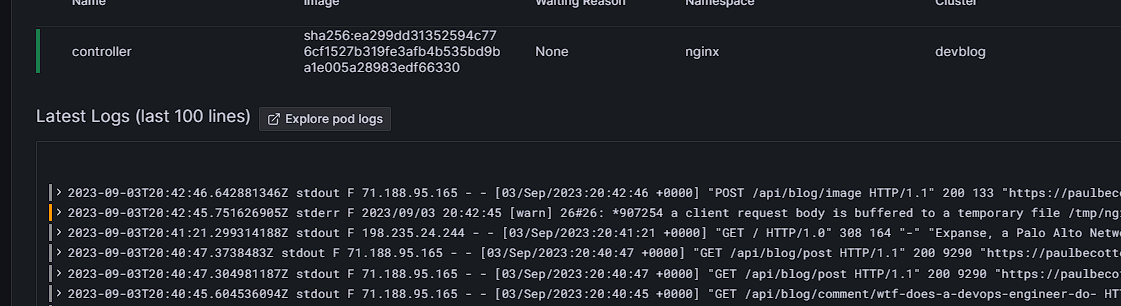
so I am not sure why the processor does not handle them correctly. Will update this when/if I debug it to figure out the disconnect.
postgres
Postgres has both a metrics and a log component. Of course, the metrics one was harder than nginx- because it needs credentials. I was able to handle this by adding the secret to the grafana-agent pods, and interpolating that value in the config file. Because its the agent and not the "logs-agent" the field is "extraConfig". This required me to make sure that the postgres password secret was created in the grafana namespace as well as the devblog one.
grafana-agent:
  agent:
    extraEnv:
      - name: DEVBLOG_PG_PASSWORD
        valueFrom:
          secretKeyRef:
            name: postgres-password
            key: password


extraConfig: |
  prometheus.exporter.postgres "postgres" {
    data_source_names = ["postgresql://postgres:" + env("DEVBLOG_PG_PASSWORD") + "@postgres.devblog.svc.cluster.local:5432/postgres?sslmode=disable"]
  }

  prometheus.scrape "postgres" {
    targets      = prometheus.exporter.postgres.postgres.targets
    job_name     = "integrations/postgres_exporter"
    forward_to   = [prometheus.relabel.postgres.receiver]
  }

  prometheus.relabel "postgres" {
    rule {
      replacement = "integrations/postgres_exporter"
      target_label = "job"
    }
    rule {
      replacement = "devblog"
      target_label = "instance"
    }
    forward_to   = [prometheus.remote_write.grafana_cloud_prometheus.receiver]
  }

logs:
  extraConfig: |
      # existing stuff...
      discovery.relabel "postgres_logs" {
      targets = discovery.relabel.pod_logs.output

      rule {
        source_labels = ["namespace"]
        regex = "devblog"
        action = "keep"
      }
      rule {
        source_labels = ["container"]
        regex = "postgres"
        action = "keep"
      }
    }

    local.file_match "postgres_logs" {
      path_targets = discovery.relabel.postgres_logs.output
    }

    loki.source.file "postgres_logs" {
      targets    = local.file_match.postgres_logs.targets
      forward_to = [loki.process.postgres_logs.receiver]
    }

    loki.process "postgres_logs" {
      stage.cri {}
      stage.static_labels {
        values = {
          job = "integrations/postgres_exporter",
          instance = "devblog",
        }
      }
      forward_to = [loki.write.grafana_cloud_loki.receiver]
    }
This got me two dashboards. One shows the logs- but seems to not do any processing and just shows a count of them, so not sure the value there. The other one was better though-
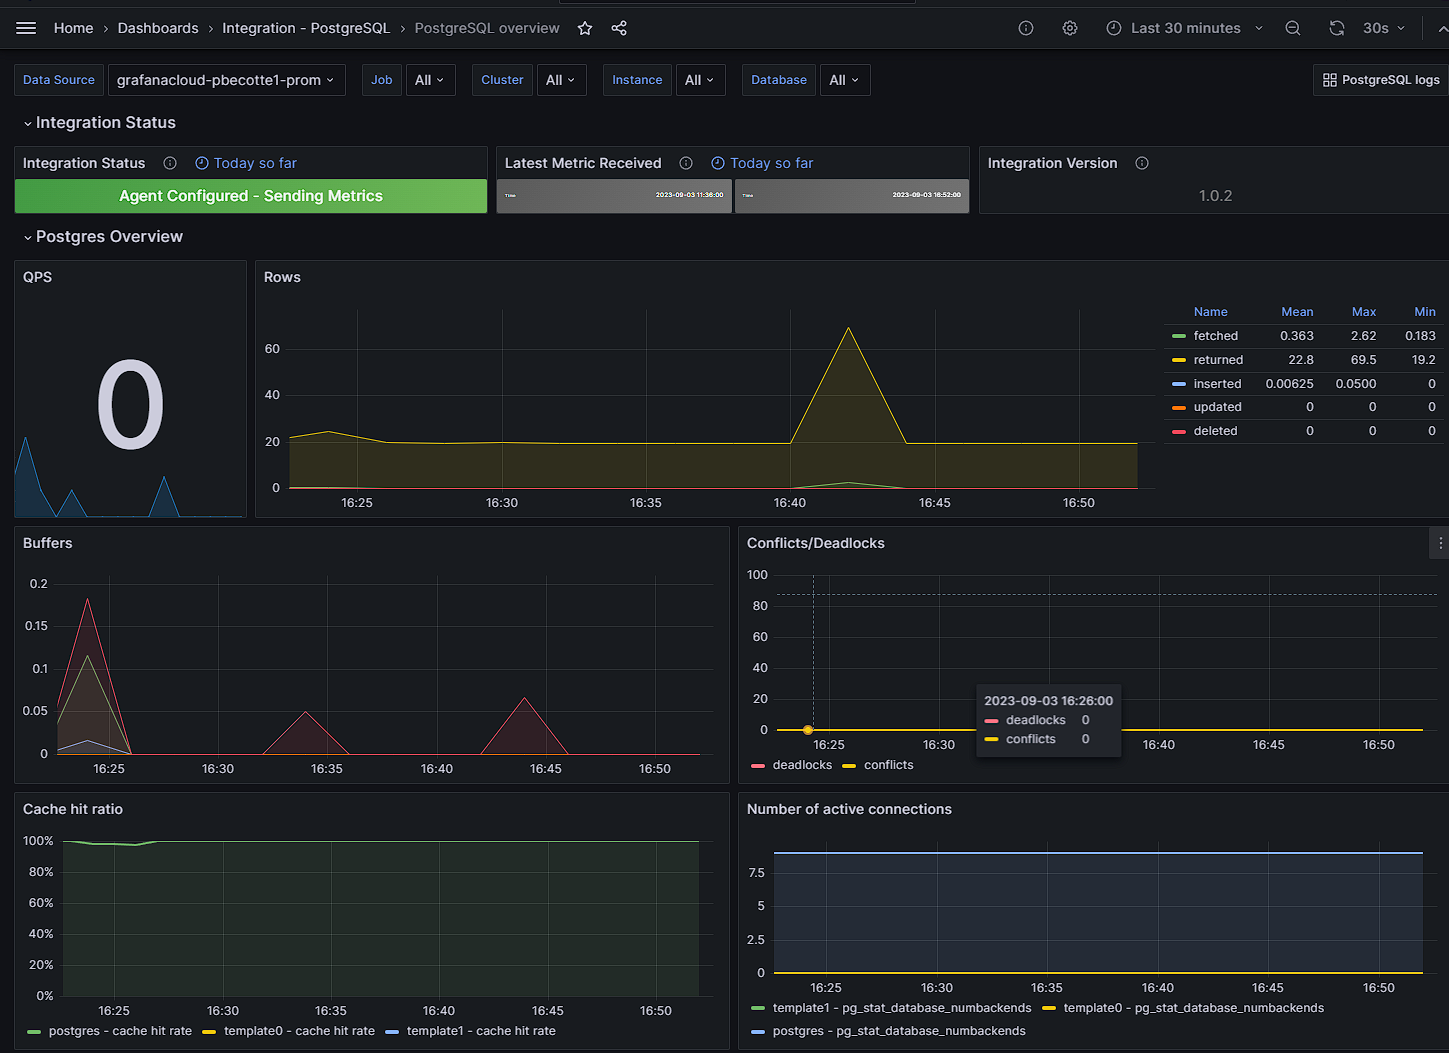
Overall, pretty nice integration. There looked to be about ten of them altogether under the kubernetes page, but there are a lot more in the overall grafana catalog. My guess is the difference is that these provide the helm chart snippets for you- but that would be less useful once you are experienced on the requirements and know how to translate non k8s config to the chart.
APM
APM is really the holy grail. Log aggregation is good, alerts and metrics from logs are better, but APM is the holy grail. New Relic APM from back when we subscribed in 2015 was really the key thing that helped us improve our software quality and reliability. The problem here is that the Grafana helm chart is really not done yet- https://github.com/grafana/k8s-monitoring-helm/issues/15
I have a good amount of experience with helm and have set this up with datadog, so had a pretty good idea of what I needed though.
-
Tell the agent (in the daemonset) to listen for open telemetry signals
-
Expose the otel ports in the podSpec
-
Instrument the flask application
The key realization is that the helm chart instantiates the grafana-agent chart twice, once as a deployment and once as a daemonset. We have to put this configuration into the daemonset part, to prevent shipping traces and logs across the cluster.
// values.yaml
grafana-agent-logs:
  agent:
    extraPorts:
      - name: otel-grpc
        hostPort: 4317
        port: 4317
        targetPort: 4317
      - name: otel-http
        hostPort: 4318
        port: 4318
        targetPort: 4318

// logs because this is the daemonset configmap, not because it is
// specifically logs
logs:
  extraConfig: |
    // ...
    otelcol.receiver.otlp "otel" {
      grpc {
        endpoint = "0.0.0.0:4317"
      }

      http {
        endpoint = "0.0.0.0:4318"
      }

      output {
        metrics = [otelcol.exporter.prometheus.grafana_cloud_prometheus.input]
        logs    = [otelcol.exporter.loki.grafana_cloud_loki.input]
        traces  = [otelcol.exporter.otlp.tempo.input]
      }
    }

    otelcol.exporter.prometheus "grafana_cloud_prometheus" {
        forward_to = [prometheus.remote_write.grafana_cloud_prometheus.receiver]
    }

    otelcol.exporter.loki "grafana_cloud_loki" {
        forward_to = [loki.write.grafana_cloud_loki.receiver]
    }

    otelcol.exporter.otlp "tempo" {
      client {
        endpoint = "tempo-prod-04-prod-us-east-0.grafana.net:443"
        auth     = otelcol.auth.basic.grafana_cloud_tempo.handler
      }
    }
    otelcol.auth.basic "grafana_cloud_tempo" {
        username = 683799
        password = local.file.loki_password.content
    }

    // Grafana Cloud Prometheus
    local.file "prometheus_host" {
      filename  = "/etc/grafana-agent-credentials/prometheus_host"
    }

    local.file "prometheus_username" {
      filename  = "/etc/grafana-agent-credentials/prometheus_username"
    }

    local.file "prometheus_password" {
      filename  = "/etc/grafana-agent-credentials/prometheus_password"
      is_secret = true
    }

    prometheus.remote_write "grafana_cloud_prometheus" {
      endpoint {
        url = nonsensitive(local.file.prometheus_host.content) + "/api/prom/push"

        basic_auth {
          username = local.file.prometheus_username.content
          password = local.file.prometheus_password.content
        }

      }
      external_labels = {
        cluster = "devblog",
      }
    }
The loki exporter is already configured in this configmap. I was able to copy the prometheus setup from the deployment configmap. The tempo part wound up being the hardest (especially because the auth setup is different!). Instead of trying to handle the new password field, I just reused the prometheus password (since its the same api token anway - interestingly, different username!).
The flask podSpec needs to be changed. We can't ship metrics to `localhost` since the pod doesn't share the host networking namespace. However, we can add an environment variable with the host IP and ship to that
env:
  - name: K8S_HOST_IP
    valueFrom:
      fieldRef:
        fieldPath: status.hostIP
OpenTelemetry has a python SDK to simplify the instrumentation process. One option is to use their binary as the entrypoint to the application, but I always worry about that working correctly (and didn't feel like adding a new entrypoint to my bazel build rule). So I imported the code directly in my python code. I discovered that there is an issue with gunicorn (and other pre-fork web servers) if the monitoring thread is instantiated - I had seen this issue with uwsigi and prometheus before. I found the necessary code at https://opentelemetry-python.readthedocs.io/en/latest/examples/fork-process-model/README.html. I also discovered that logs only show up in the APM dashboard if they are instrumented with span info- AND collected with otel. I spent a while figuring out how to add an extra rewrite rule to the grafana-agent logs to add the necessary label, but it was fruitless- the logs only count if they get pushed through the otel collector. The code I found there is marked experimental, but I was able to attach their special log handler to the root logger without disabling the existing handler that writes to disk.
agent_url = f"http://{os.environ.get('K8S_HOST_IP', 'localhost')}:4317"


def post_fork(server, worker):
    server.log.info("Worker spawned (pid: %s)", worker.pid)

    resource = Resource.create(
        attributes={
            "service.name": "devblog-backend",
            # If workers are not distinguished within attributes, traces and
            # metrics exported from each worker will be indistinguishable. While
            # not necessarily an issue for traces, it is confusing for almost
            # all metric types. A built-in way to identify a worker is by PID
            # but this may lead to high label cardinality. An alternative
            # workaround and additional discussion are available here:
            # https://github.com/benoitc/gunicorn/issues/1352
            "worker": worker.pid,
        }
    )
    logger_provider = LoggerProvider(resource=resource)
    set_logger_provider(logger_provider)
    formatter = logging.Formatter(
        fmt=(
            "%(otelSpanID)s %(otelTraceID)s %(otelServiceName)s %(otelTraceSampled)s"
            "%(asctime)s %(levelname)s [%(name)s] %(message)s"
         ),
        defaults={"otelSpanID": "", "otelTraceID": "", "otelServiceName": "", "otelTraceSampled": ""},
    )
    exporter = OTLPLogExporter(endpoint=agent_url, insecure=True)
    logger_provider.add_log_record_processor(BatchLogRecordProcessor(exporter))
    handler = LoggingHandler(level=logging.NOTSET, logger_provider=logger_provider)
    handler.setFormatter(formatter)

    # Attach OTLP handler to root logger
    logging.getLogger().addHandler(handler)

    trace.set_tracer_provider(TracerProvider(resource=resource))
    span_processor = BatchSpanProcessor(
        OTLPSpanExporter(endpoint=agent_url, insecure=True)
    )
    trace.get_tracer_provider().add_span_processor(span_processor)

    reader = PeriodicExportingMetricReader(
        OTLPMetricExporter(endpoint=agent_url)
    )
    metrics.set_meter_provider(
        MeterProvider(
            resource=resource,
            metric_readers=[reader],
        )
    )
I added the SQLAlchemy instrumentation as well, which made my sql queries show up as a downstream application and even let me see the actual queries
            self._engine = create_engine(
                config.SQLALCHEMY_DATABASE_URI,
                connect_args=config.SQLALCHEMY_CONNECT_ARGS,
            )
            SQLAlchemyInstrumentor().instrument(engine=self._engine)
The end result is pretty good-
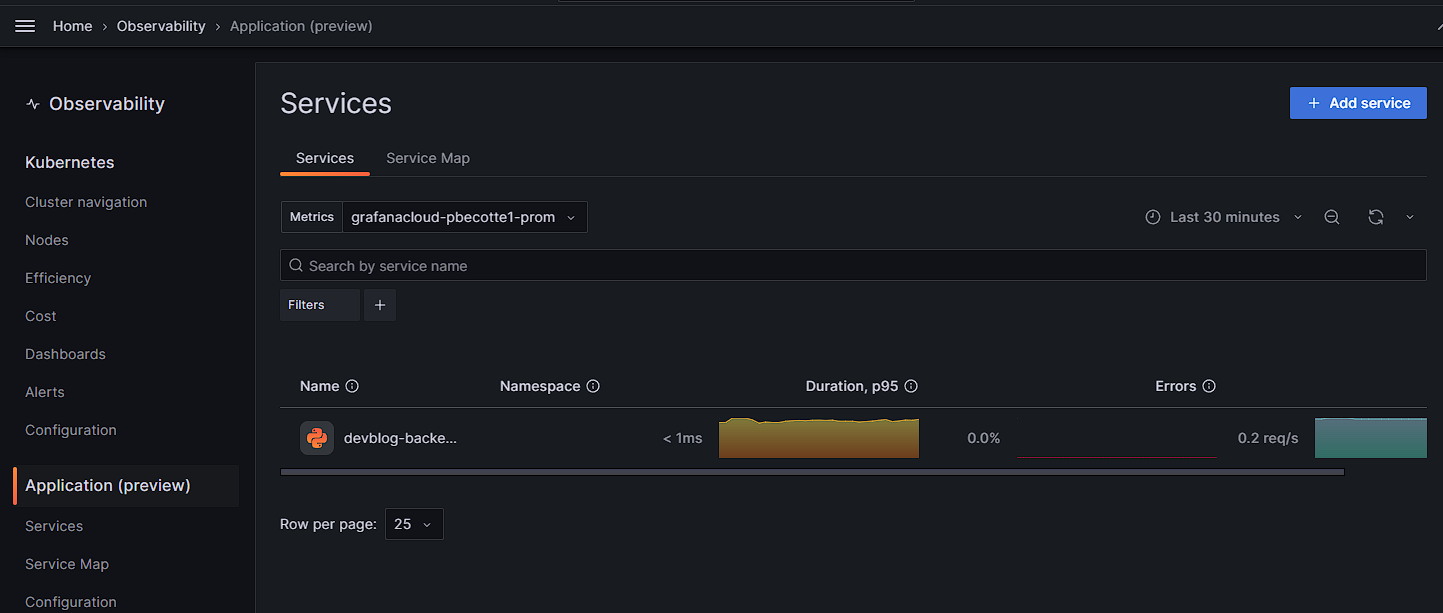
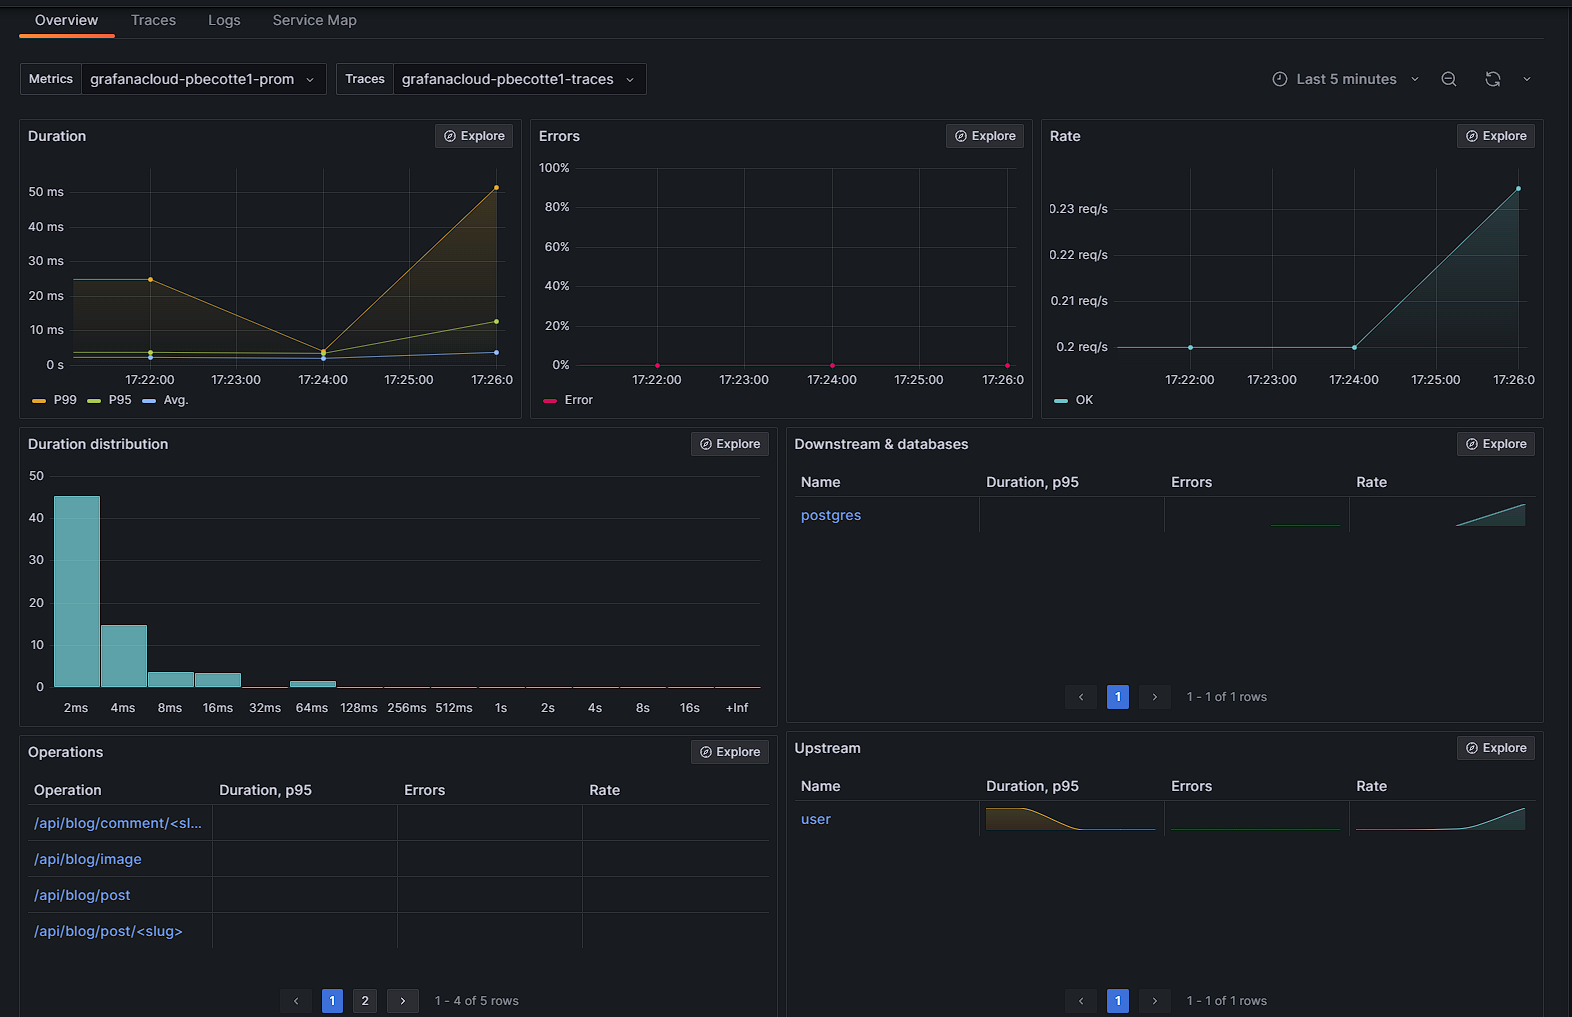
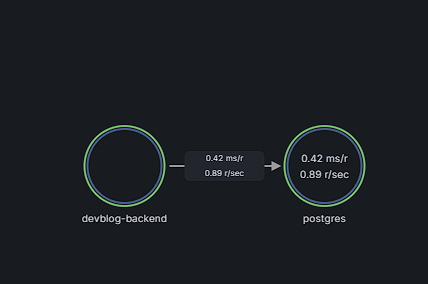
There are rough edges though. It would show me the requests per second for the DB and even the queries, but clicking into see the actual traces returns an error-
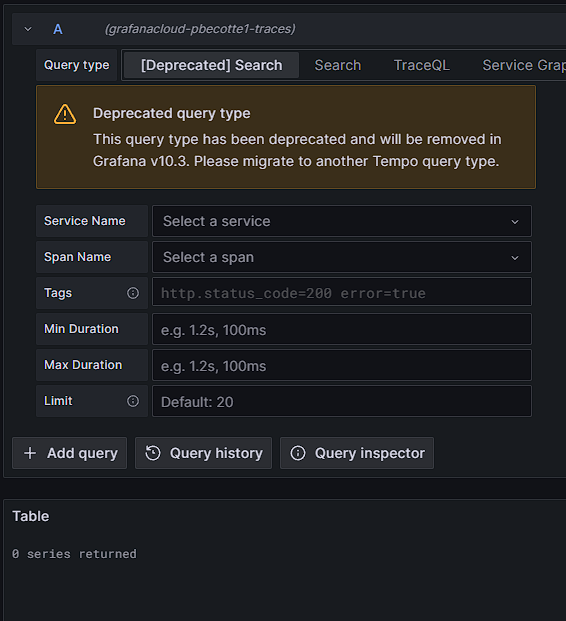
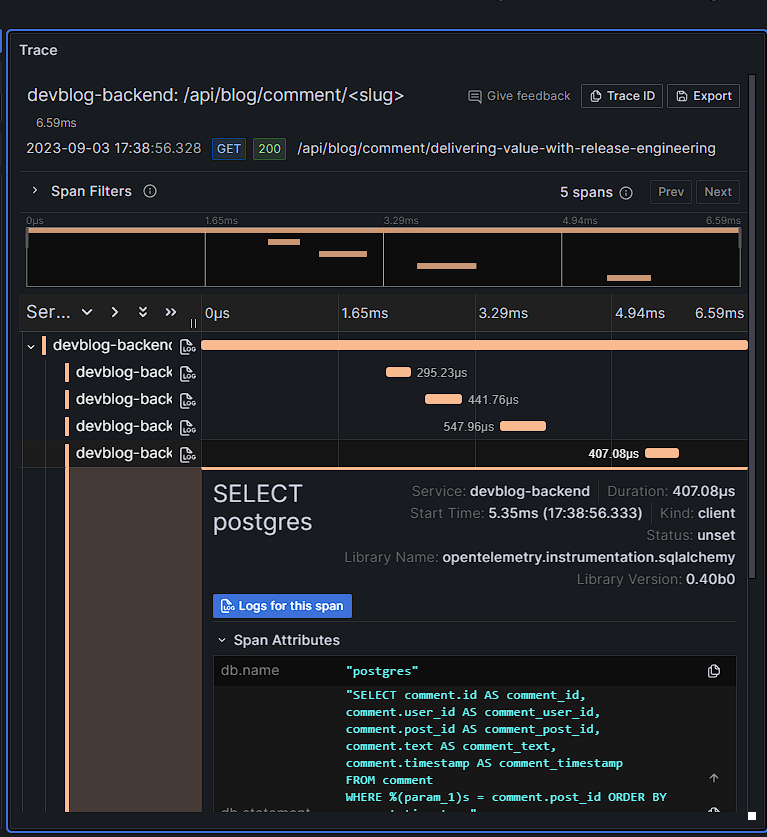
It also shows `user` as an upstream service to my app, which doesn't make sense. Maybe its just the slightly weird structure of my flask app. Clicking neither service shows anything other than "no data"- not even the postgres dashboard I created earlier. I also couldn't click through anywhere to figure nout where `user` was actually coming from in the traces. I liked the out of the box dashboards and metrics- but the first thing I tried to do didn't work. I wanted a dashboard of number of page loads per blog post. There is a generated metric for that, but it only has a label for '/api/blog/post/
I also added aws instrumentation, but never saw any traces marked with aws as a target.
Conclusion
In the end, this is a solid product. Not having to run the four services is a big win, and it looks like my full usage with everything I could find turned on will fall under their free tier (very much not the case with Datadog!). On the other hand, more stuff didn't work out of the box than I was hoping for, and it will clearly take a decent amount of learning to get everything working properly- but to be fair, thats true of every platform I have tried. For an open source hobby project, I think it has a ton of promise and will continue using it. Am kind of curious how much effort it would take to build reasonable k8s or APM dashboards on top of open source grafana- but that's a mission for another day!