Update on Grafana Monitoring
Replacing Grafana Agent with Alloy and k8s-monitoring
Last September, I wrote about setting up Grafana Cloud monitoring for my Flask application. While that setup worked, it required complex configuration of the Grafana Agent. Recently, Grafana has replaced their agent with Alloy, a new OpenTelemetry collector that promises to simplify the entire observability stack. Let's see how it compares.
The Old Way: Grafana Agent
In my previous setup using the k8s-monitoring helm chart with Grafana Agent, I had to:
-
Configure complex OTEL receivers and exporters
-
Handle secrets through direct helm values
-
Manually set up each observability signal
-
Write extensive configuration for integrations
For example, just setting up basic tracing required this configuration:
otelcol.receiver.otlp "otel" {
  grpc {
    endpoint = "0.0.0.0:4317"
  }
  http {
    endpoint = "0.0.0.0:4318"
  }
  output {
    metrics = [otelcol.exporter.prometheus.grafana_cloud_prometheus.input]
    logs    = [otelcol.exporter.loki.grafana_cloud_loki.input]
    traces  = [otelcol.exporter.otlp.tempo.input]
  }
}
The New Way: Alloy
The new Alloy-based approach in the same helm chart is dramatically simpler. Here's the entire configuration needed for a complete observability stack:
cluster:
  name: devblog

externalServices:
  prometheus:
    secret:
      create: false
      namespace: alloy
      name: prom-creds
  loki:
    secret:
      create: false
      namespace: alloy
      name: loki-creds
  tempo:
    secret:
      create: false
      namespace: alloy
      name: tempo-creds
  pyroscope:
    secret:
      create: false
      namespace: alloy
      name: pyro-creds

metrics:
  beyla:
    enabled: true

traces:
  enabled: true

opencost:
  opencost:
    exporter:
      defaultClusterId: devblog
    prometheus:
      existingSecretName: prom-creds
      external:
        url: "https://prometheus-prod-13-prod-us-east-0.grafana.net/api/prom"

profiles:
  enabled: true

test:
  enabled: false

beyla:
  enabled: true
That's it! This configuration provides:
-
Metrics collection with Prometheus
-
Log aggregation with Loki
-
Distributed tracing with Tempo
-
Continuous profiling with Pyroscope
-
Auto-instrumentation with Beyla
Key Improvements
A Ton of Support for Auto-Discovery
The chart now comes out of the box with support for discovery of metrics and logs with pod annotations. For example, instead of having to figure out how to insert the postgres exporter into the Alloy config, it was easy to add a pod like this-
apiVersion: apps/v1
kind: StatefulSet
metadata:
  name: postgres-exporter
  namespace: devblog
spec:
  replicas: 1
  selector:
    matchLabels:
      svc: postgres-exporter
  serviceName: postgres-exporter
  template:
    metadata:
      annotations:
        # let me add labels to the metrics collected from this pod
        k8s.grafana.com/job: integrations/postgres_exporter
        # let me add labels to the logs collected from this pod
        k8s.grafana.com/logs.job: integrations/postgres_exporter
        # these annotations configure alloy to scrape metrics from this pod
        k8s.grafana.com/metrics.portNumber: "9187"
        k8s.grafana.com/scrape: "true"
      labels:
        svc: postgres-exporter
    spec:
      containers:
      - env:
        - name: DATA_SOURCE_URI
          value: postgres.devblog.svc.cluster.local:5432/postgres?sslmode=disable
        - name: DATA_SOURCE_USER
          value: postgres
        - name: DATA_SOURCE_PASS
          valueFrom:
            secretKeyRef:
              key: postgres_password.txt
              name: postgres-password
              optional: false
        image: bitnami/postgres-exporter:latest
        name: exporter
        ports:
        - containerPort: 9187
          name: exporter
          protocol: TCP
        resources:
          requests:
            cpu: 10m
            memory: 40Mi
Standardized Secret Management
Instead of having to manually add extra volumes with secrets to the pods, the helm chart now just supports providing a secret name out of the box-
externalServices:
  prometheus:
    secret:
      create: false
      namespace: alloy
      name: prom-creds
  loki:
    secret:
      create: false
      namespace: alloy
      name: loki-creds
  tempo:
    secret:
      create: false
      namespace: alloy
      name: tempo-creds
  pyroscope:
    secret:
      create: false
      namespace: alloy
      name: pyro-creds
What About Those Rough Edges?
In my previous post, I encountered several issues:
Complex OTEL configuration for traces
This wound up working out of the box- they automatically add otel ingesters on the logging daemonset, and configure it correctly to add necessary labels to metrics and traces it captures. They also let you enable **beyla **to get eBPF based tracing enabled on every service without any instrumentation at all (though real tracing is still helpful for things like api endpoints or sql queries).
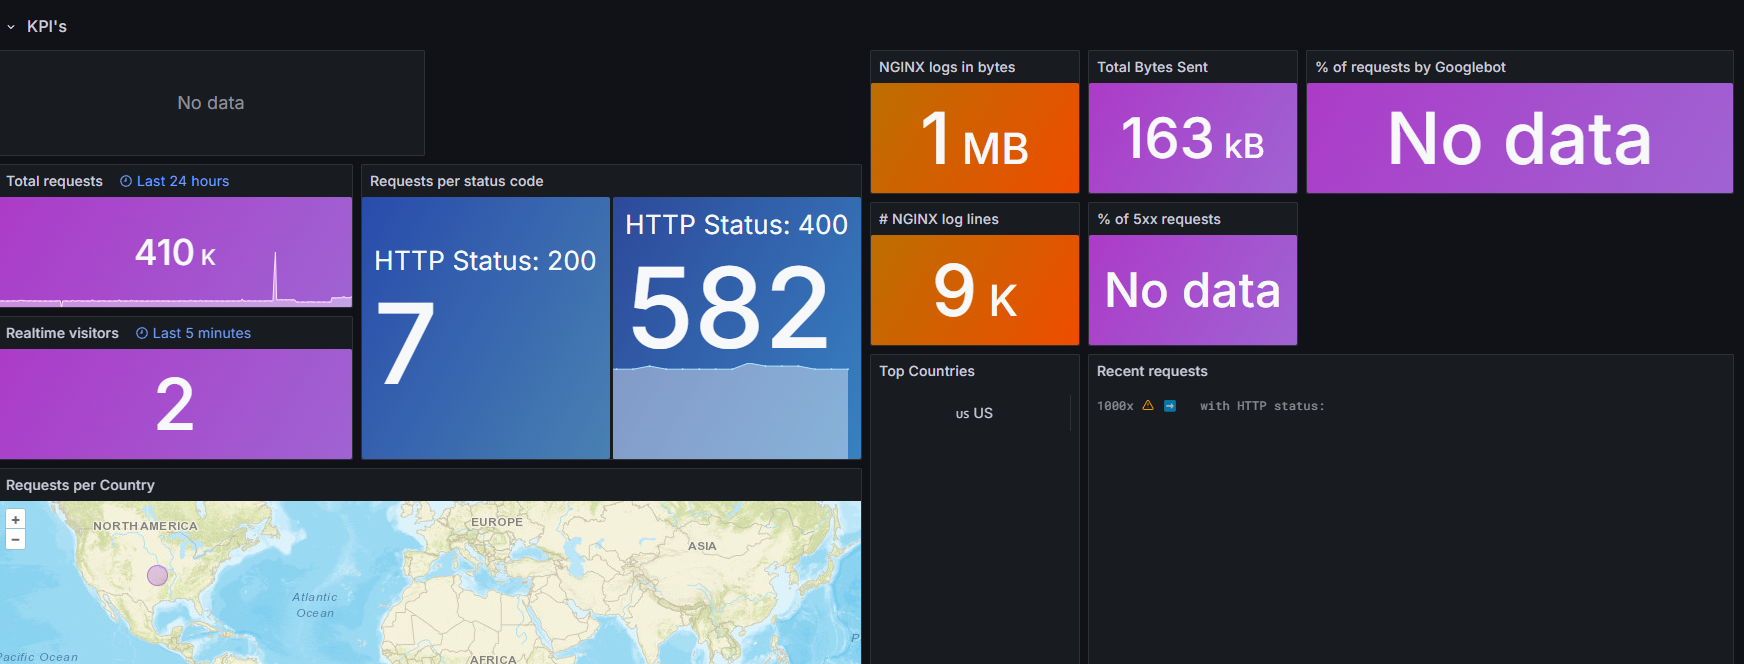
Difficulty with nginx log parsing This may just be that their documentation was better, but it explained how to re-configure the nginx ingress log format to allow their dashboard to work. Once that was done, every panel was as expected-
Problems with PostgreSQL integration
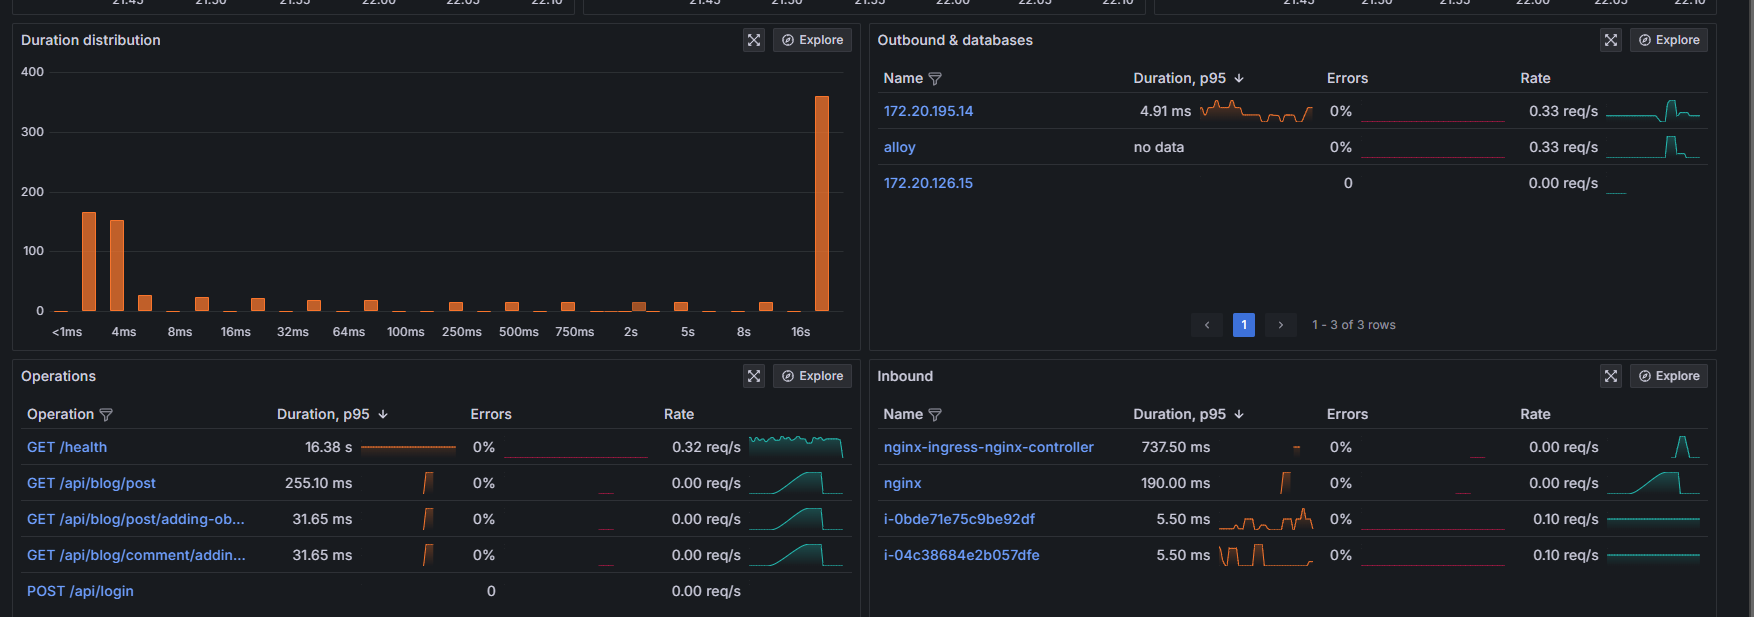
Limited visibility into trace relationships This still doesn't seem to work correctly. I'm less confused than last time- I no longer see `user` on my service graph. However, I see a lot of unlabeled IPs, and I see the nodes on the graph. My guess is that Beyla's traces and OTel's are getting confused, and some configuration is needed to align them. I found it amusing that the graph didn't actually show requests from my app to postgres, which is a step back from last time. I didn't spend very long on this though!
New Problems
Not sure if this is fair, but may as well be included. One of the reasons I went in to do this was because I started getting emails a little while ago that I was over the limit for free metrics. Which felt weird, since this site doesn't exactly get a lot of traffic. I had figured that enabling EKS Auto-Mode would allow me to drop a couple nodes from the cluster (and try out their new stuff). TLDR, I'm still over the limit, despite being at two nodes now. I haven't dug in to figure it out- possibly beyla emits a lot of metrics? Perhaps because opencost is working correctly?
More importantly though, they have changed their pricing model. I'll need to talk with their salesguy at work to understand it, but I don't believe that "Kubernetes Monitoring" or "Application Monitoring" are included with Grafana Enterprise anymore. Instead there is a "per host" charge that they're sticking in there. This won't effect my personal stuff (well, maybe they'll shut me off, but I already pay enough for this site lol) ... but we did a vendor comparison at work last year. Grafana's huge selling point versus some of their competitors was the simplified pricing- pay for the amount of data. If you want to pay less, send fewer metrics, or at a lower frequency or cardinality. Very customer friendly. Charging per number of hosts though- means there's a floor to how low you can go without just turning it off, which means, it will get turned off in dev and QA and "less important" prod environments at many companies. Worse- the price seems pretty high and does NOT actually cover the metrics/logs/traces. I haven't done a proper comparison, so may be wrong- but if I understand correctly it may be the highest price in the industry. Nobody asked me, but considering virtually every company is talking about moving off of the "expensive" vendors in this space, it feels like the wrong move to try and make the one company building customer friendly offerings to pivot away.
Conclusion
This article is relatively short- the transition to EKS Auto Mode wound up being the much heavier bit- including wiping out my cluster twice (once by accident- `terraform apply -auto-approve` never a great idea! However, the transition from Grafana Agent to Alloy represents a significant improvement in the Kubernetes observability experience. What previously took hundreds of lines of configuration and several hours of troubleshooting can now be accomplished with a few simple YAML blocks.
While Alloy is still relatively new, it's clear that Grafana is making the right architectural choices. The OpenTelemetry-native approach, simplified configuration, and improved integration story make it a compelling choice for Kubernetes observability.
For my personal projects, this simplification is a game-changer. I get the same (or better) observability coverage with significantly less configuration and maintenance overhead. If you're currently using the Grafana Agent or considering Grafana Cloud for your Kubernetes monitoring, I'd strongly recommend looking at the new Alloy-based approach.